I’m not sure these are finished, but they are well underway.
Sustainability = the capacity of the people living in a community to meet all their needs, using the time and skills of the population and the energy, resources, and ecological functions from the land/air/water that they are stewards of, in perpetuity.
Development = the increase in quality of life within a community between two points of time
Sustainable Development = an increase in quality of life of the population of a community between two points in time, using the time and skills of the population and the energy, resources, and ecological functions from the landmass they are stewards of, in a manner that can be maintained in perpetuity.
Economy = the use of trade to access critical resources otherwise unavailable to the individual, industry, and government; to disburse wealth throughout the community; and to facilitate the creation and use of infrastructure of all kinds.
Infrastructure = an investment of time and resources with an expectation of a return on that investment in the form of time and/or resources into the future.
Economic Sustainability = the capacity of the people of a community to meet their needs through internal trade arrangements and co-management relationships with other communities, so that no skills, resources, or ecological services are required to be purchased from outside of the community and its partners, to meet needs, in perpetuity.
Sustainable Economic Development = an increase in the quality of life between two points in time by increasing specialization and productivity of the population, while reducing the internal barriers to trade of critical resources and the external barriers to co-management of critical resources, and retaining a sufficient financial reserve to address economic disruptions.
Society = the use of community by its citizens to encourage the conditions that allow people to have their needs met more efficiently and effectively than is possible as a family.
Social Sustainability = the capacity of the people of a community to ensure they can operate as a cohesive group by having a sense of mutual respect, equity, and belonging, and generally agreed-on goals and aspirations, past any planning horizon.
Sustainable Social Development = an increase in the quality of life of a community between two points in time, by encouraging the unique customs, arts, and social institutions of those people that provide them with a sense of mutual respect, equity, and belonging while ensuring that no subset of the community receives a greater burden than benefit from any development initiative.
Ecology = the ecological capital and functions of the land, water, and air that the people of a community are stewards of.
Ecological Sustainability = the capacity of the people of a community to maintain the ecological functions of the land, air, and water that they are stewards of, in perpetuity.
Sustainable Ecological Development = an increase in the quality of life of the people of a community between two points of time by restoring or enhancing the ecosystem services that provide resources and absorb waste from the land/water/air that they are stewards of, while ensuring that a non-declining portion of each biome is maintained as a ‘wilderness’ that is neither a sink for wastes nor a source for resources.
Quality of life is dependent on how needs are met. There is no concensus on a specific exclusive definition of Quality of Life. I will introduce two concepts that are expected to cover the range of the term.
Potential Quality of Life = the time available within a community for activities other than those that are expected to meet needs, while considering the impact of the eventual loss of overconsumed resources
Actualized Quality of Life = the time available within a community for activities other than those that are expected to meet needs, while considering the impact of the eventual loss of overconsumed resources, as if all needs were met.
Meeting Needs = activities that prevent the degradation of the self, family, or community. Needs themselves are aspects of being human and are universal and invariant.
Technological Development = the creation or enhancement of systems of infrastructure with an expectation of an improvement in the actualized quality of life of a community.
Sustainable Technological Development = the creation or enhancement of systems of infrastructure with an expectation of an improvement in the quality of life of a community, focusing on the needs of the community and the resources available in perpetuity.
Human Development = the identification and removal of the obstructions that prevent people from being able to meet their needs, and the education, encouragement, and advocacy for people to take control of their lives and social environment, such that freedoms, choices, and capabilities are enhanced.
Sustainable Human Development = the identification and removal of the obstructions that prevent people from being able to meet their needs and the education, encouragement, and advocacy for people to take control of their lives and social environment, such that freedoms, choices, and capabilities are enhanced, in a manner that can be maintained in perpetuity.
Community Development = the reduction of disparity and the increase in social integration, allowing people to meet more needs by working better together.
Sustainable Community Development = the reduction of disparity focused around the resources and ecological functions that are available in perpetuity, and the increase in social integration at a greater scale.
Critical Resource = any of a renewable or non-renewable resource or an ecological function that is used to meet needs.
This essay is the logic, method, and math for Sustainable System Design. Normally, the economist acts as the system manager (or pilot) of the complex system that we call ‘our society’. Their role is aided by the use of indicators, indices, and the controls available to adjust the performance of components of the system. This paper isn’t really for them. Rather, this essay is intended for the system designers. The naval architect designs a system that is expected to achieve some specified target performance envelope. Instead of using indicators, she will use the units of measure for the system, and the rate equations between those units, to check to see if a predicted set of future conditions will produce an acceptable set of outcomes. Her role is not in contrast to the pilot – the pilot still has to manage the system. But the designer has the responsibility to ensure that the desired performance envelope can be achieved. This essay explains how that can be checked when designing for Absolute Sustainable of Communities.
From first principles:
People use their time to meet their wants and needs: This is the foundation of our current understanding of economics and can be paraphrased from the first 2 sentences of the Wealth of Nations. In a world that is significantly over-capacity, we require more nuance.
People use their time and the ecological functions of the landmass to which they have access to meet their wants and needs, or they use their time and energy to convert resources into the means to meet their wants and needs: This is an expansion, providing some of the ‘how’, and also indicating there will be a relationship between both time use and ecological footprint, and time use and energy use. The ecological functions available are inversely proportional (in some way) to the time required to meet needs, and the energy use acts as a time multiplier, increasing the effect of the time used.
This is not wholly complete. There can also be the use of ecological functions that meet wants and needs that do not use human time (such as breathing air), and there can be the use of energy to convert resources into the means to meet wants and needs that do not use human time (such as fully automated systems). I refer to them as ‘manna from heaven’ and ‘robots building robots’ respectively, and while they do exist in principle, they do not have a specific role in our existing economy. In a hunter-gatherer culture, manna from heaven could have made a difference between survival and extinction, by stumbling across a cave for shelter or a spring for water. In an energy-intense future, it is in the realm of speculative fiction that robots building robots will play a significant role in society. For now, though, these exceptions can be overlooked, with the caveat that the conclusions made by excluding them would have to be checked to see that the conclusions still hold true with them included.
People will use their time and the ecological functions of the landmass that they are stewards of to meet their needs, or they will use their time and energy they can produce in perpetuity to convert resources into the means to meet their needs. This restriction incorporates the basic principles of Sustainability that require planning to meet needs beyond any rational planning horizon. Any resources or ecological functions that are not being stewarded by the community are assumed to become unavailable to the community at some near-future time – either by trade disruptions (war, pandemic, economic constriction) or by exhaustion (Peak Oil, fisheries collapse). Active planning is the only method to avoid the Tragedy of the Commons, and this relies explicitly on stewardship of the ecological functions, energy, and resources.
Needs themselves are understood through Max Neef et al, and Doyal and Gough. Needs are universal and invariant, and are aspects of human nature. Everyone, everywhere, has the same needs, but the means to meet those needs can be very different between individuals, families, and communities. Needs are met through activities, and these activities required human time, and meeting needs prevents degradation to the self, family, or community.
We must distinguish between needs (like sleep, food, water/hygiene/sanitation, etc) and the means to meet needs (like money, tools, infrastructure, etc). A job, for example, can meet a need for the community (like education or health care) and the individual (maybe respect of and for one’s peers), but just as easily it may meet no need at all (like selling popcorn to movie-goers, or advertising cherry cola). The test to determine the one vs the other would be by identifying the harm that the activity prevents. Thus the popcorn vender may ‘need’ the income, but the activity prevents no specific harm. Contrary to Our Common Future, a job is not a need, in and of itself – children don’t suffer harm from not having a job, nor do the retired or idle rich. ‘Purpose’, perhaps, is a need, but not paid employment, unless it specifically addresses the needs of the individual, family, or community. While I have no data to support the supposition, chronic stress may be a universal indicator of unmet needs – if one’s job prevents chronic stress, then it is possible that it does meet a need.
This suggests the basic elements of a sustainable community would be found in time-use, resource use, ecological functions, and energy. Money is a medium of exchange, and allows specialization and the creation/operation of infrastructure to increase the efficiency and effectiveness of how the time is used, but ultimately it is one of the means to meet needs, and the paid economy is a tiny fraction of the activities that people use to meet their needs. By focusing on time-use to meet needs specifically, we are observing the one thing that is universal to all people, no matter the era, technology, or culture.
Sustainability is the capacity of the people of a community to meet all of their needs using their skills and time, and the ecological functions, energy, and resources of the land that they are stewards of, in perpetuity. That is to say, Community Sustainability in an absolute sense is achieved through Needs Security. Needs Security depends on Needs Sovereignty at multiple scales simultaneously, with potentially a unique combination at each scale, for each need, and each community.
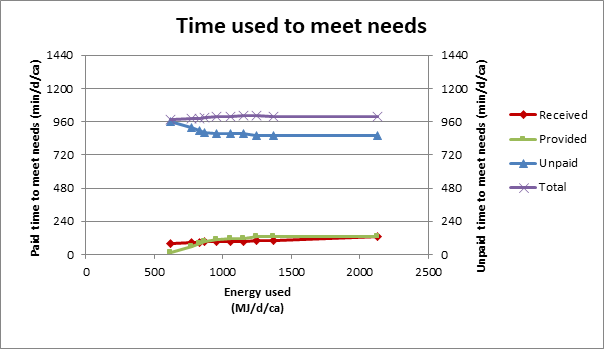
In Figure 1 below shows the paid time used to meet needs, both provided to the community through paid employment and received from the community as embodied time in the goods and services received. It also show the unpaid time, and the total time provided to the self, family, and community. The total time used to meet needs includes mobility for paid employment, but it is not included in any of the other curves.
Figure 1
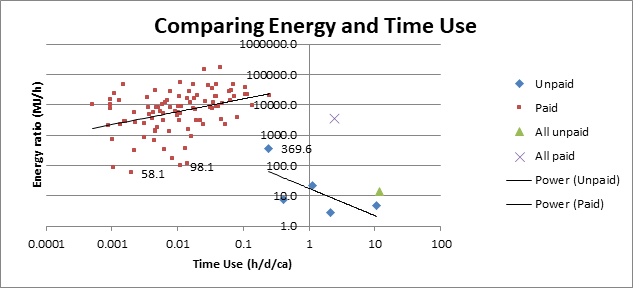
Due to the relative simplicity of collecting labour data, this has been shown as paid vs unpaid activities. It is possible that the activities that primarily deal with energy vs activities that primarily do not should be considered separately. Thus cooking and heating homes could be in the ‘using energy’ side, but would be unpaid activities, and massage therapy and marriage counselling could be in the ‘not’ side, but would be paid activities. In general, though, as seen in Figure 2, most paid activities rely on using energy to converting resources into the means to meet our wants and needs, with a higher energy ratio being associated with additional time use in society, while most unpaid activities rely on using time directly at much lower (roughly 2%) energy intensity, with a lower energy ratio associated with additional time use. The two ‘summed’ values are:
Hours used (h)
Energy used (MJ)
Energy ratio (MJ/h)
Paid Time
2.44
8531
3497.1
Unpaid Time
11.8
170
14.42
Table 1: Time Use, Energy Use, and Energy Ratio for Paid and Unpaid Activities – Canada 2005
Figure 2
While this does not exactly correlate to high-energy and low-energy intensity activities, generally unpaid activities use less energy per hour as time-use goes up, and generally paid activities use more energy per hour as time-use goes up, and thus they have different characteristics with respect to energy use. The distinction of paid vs unpaid activities, at least in Canada, can be taken as the same distinction between energy ‘rich’ vs energy ‘lean’ activities.
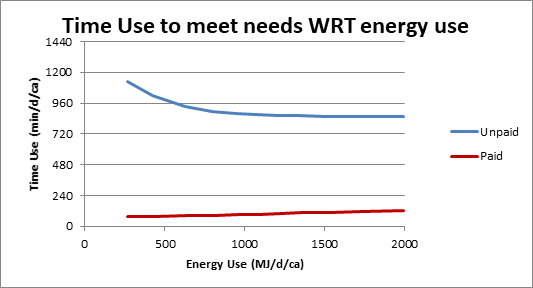
We can find the best fit line for the various curves across the community, and plot the time used in paid and unpaid activities that meet needs against energy use, and plot them against the other in Figure 3:
Figure 3
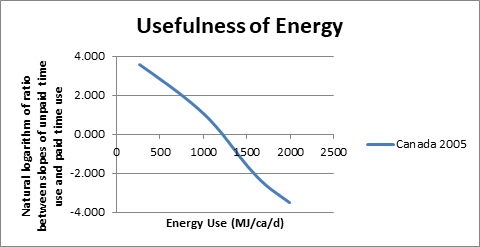
If energy is a time multiplier, we would expect to see a relationship between the amount of time that is used in unpaid activity and with paid activity that is related in some way to the amount of energy used. The graph below compares the slope of the two curves above and therefore finds the incremental rate of time use between paid and unpaid activities, plotted against the energy used. This therefore predicts the usefulness of energy, with Figure 4 showing the the natural logarithm of the ratio between the slopes of the best fit curves for the paid and unpaid time use plotted against energy use.
Figure 4
At about 1200 MJ/ca (25% more than average consumption in Canada in 2005), the slopes of the two curves are equal (ln(ratio) =0), indicating that the combined time use to meet needs increases for energy use greater than that. In effect, consuming more energy decreases the potential quality of life of the community. There is insufficient information to determine how this ratio compares to Effectiveness, although Effectiveness may increase somewhat linearly with energy use.
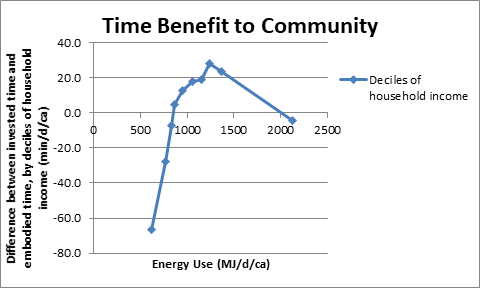
Increased energy use may decrease time use for the individual, but the community may cease to gain as a whole as a result. This can be seen from a slightly different perspective in Figure 5, looking at absolute differences rather than ratios.
Figure 5
Each decile of household income is plotted with their energy use (direct and embodied) and the difference between their paid employment and the embodied time of the goods and services they consume. Unsurprisingly, the poorest people in the community use more paid time than they provide. This is a function of our social safety net, ensuring that most people will have some portion of their needs met, even if they don’t have sufficient paid employment to pay for it. The richest decile uses more embodied time in the goods and services they use than they produce in paid activities that meet needs. This indicates that the highest paid people tend to make more of their income in meeting wants than meeting needs.
Assuming an energy transition that leads to only high EROI sources (eg, loss of tarsands and shale oil production) we would expect 645 MJ/d/ca to be available to Canadians (in the absence of a very significant investment in wind, solar, and energy storage). At this amount of energy use, unpaid activities (thus quality of life) will take significantly longer (in the order of 150 minutes more), and paid activities (and thus GNP) will amount to about 81% of what was present in 2005 – roughly 80 min/d/ca . The distribution of time and energy use would change as well, so this is perhaps indicative of a trend rather than a specific value.
To ensure that quality of life does not drop over the expected duration of transition, an understanding of the amount of high-EROI sources that have to come on-line over what period of time is absolutely necessary. We use about 1000 MJ/ca/d today, and in 25 years, we’re going to be using sources that produce about 650 MJ/ca/d today – a loss of 35% of available energy. Even if we try to keep the energy use into the positive range of net time benefit, that would be close to 800 MJ/ca/d. That means over the next 25 years, we, in Canada, have to produce approximately 25% more energy using hydro, nuclear, solar, and wind.
Alternatively, we could focus on Human Development, and find ways of increasing how effectively people are able to use their time to meet their needs. This would entail identifying and addressing the obstructions within individuals, families, and the community that are preventing people from meeting their needs. This is a non-trivial problem, and requires relatively modest investments, at least to begin with. It can be shown how such investments produce a significantly higher return in the form of quality of life than an investment in technological development.
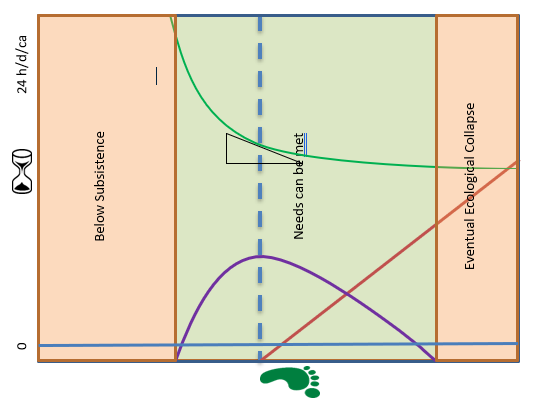
In Figure 6 below, unpaid time use to meet needs is plotted against ecological footprint. shown as the solid green line. The dashed blue line is the community managed biocapacity (CMBC), which is the amount of ecological footprint we use that we can supply from the land we are stewards of. The slope of the time use curve at the CMBC is the future time cost (FTC) associated with excess resource consumption. The slope multiplied by the amount of over-consumption is plotted in red, and this represents the impact on the future society from deprivation or substitution. In Canada in 2005, the slope of this line was -9.5 min/d/GHa. The FTC associated with a loss of energy consumption is the change in slope of the curve at the projected energy use, multiplied by the change in energy use, and is shown in blue. In Canada in 2005, the median value of energy use was 1006 MJ/d/ca, and the slope time the TU curve was -0.0285 min/MJ. At 800 MJ/d/ca, the slope would be -0.125 min/MJ, for an overall change in time use of ((-0.0285 +0.125 min/MJ)*(1006-800 MJ/d/ca)=) +20.0 min/d/ca, and that is independent of ecological footprint.
In Figure 6, the Potential Quality of Life is plotted in purple, and it is the time available for activities other than those expected to meet needs, less the future time cost associated with excess resource consumption. Where the Potential Quality of Life is greater than 0, the community has the capacity to meet their needs within ecological functions they are stewards of.
Figure 6 – Developing Potential Quality of Life with Future Time Costs (NTS – exaggerated for effect)
We can notice in the data that that the poorest decile of the population uses about 2/3 of their time to meet their needs, but it is not expected that all of their needs are being met. This suggests that there are some kinds of obstructions that prevent their needs from being met – something is stopping their potential from being actualized. These obstructions can be part of the individual (e.g. addiction, ignorance), the family (e.g. rigid gender roles, neglect/abuse), or the community as a whole (e.g. tribal fundamentalism, structural inequities), but they affect the individual, family, and community in various ways. These obstructions interfere with how effectively people can use their time to meet their needs.
We can estimate the magnitude of the effect of these obstructions by comparing people with the same amount of access to ecological functions, differentiating between those who have symptoms of specific unmet needs vs those who do not. Thus, if the needs include ‘sleep’, and within a particular community the symptoms of Sleep Insecurity is fatigue and the use of stimulants, then part of the time-use study would include questions about fatigue and the use of stimulants. The time use at sleep of those people who have those symptoms would be compared to the time use at sleep for those people who do not have symptoms, and the amount of time that would be expected to be required so that all people could have Sleep Security, if time was the only barrier, can be estimated. The ratio between the average time use and the expected time use is ‘effectiveness’.
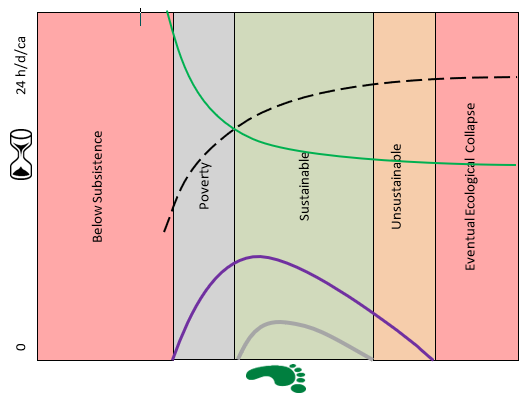
In the graph below, the Effectiveness is shown as the dashed black line. The Actualized Quality of Life is then plotted from the Potential Quality of Life and the Effectiveness of the community, and is shown as the grey line.
Figure 7 – Developing Actualized Quality of Life with Effectiveness (NTS – exaggerated for effect)
The zone framed by the PQoL and the AQoL represents the upper and lower bounds of long-term quality of life that the future can experience. The AQoL will come to pass if we make no effort to remove the obstructions in society that prevent needs from being met. The PQoL would come to pass if we manage to remove all of the obstructions in society that prevent needs from being met. Reality will exist between those two bounds.
Subsistence occurs when people use all of their time to meet their needs, regardless of whether all of their needs are met or not. Poverty occurs when people use less than all of their time to meet their needs, but their needs can not actually be met in 24h/d/ca – their time must be subsidized in some way. The peak PQoL occurs when the ecological footprint of the community matches the biocapacity of the land they are stewards of. The peak AQoL occurs with slightly higher consumption, due to the increased effectiveness at the higher ecological footprint. This creates a range (not shown) where Sustainable Growth and Sustainable Degrowth both play parts in some form of dynamic equilibrium.
For each design alternative, the designer is to estimate the change in Time Use to meet needs, Future Time Costs, and Effectiveness, and from that determine the expected Time Use to meet needs, Potential Quality of Life, and Actualized Quality of Life in a future where all over-consumed resources, energy, and ecological functions cease to be available, and compare the results to the life-cycle (cradle to cradle) costs associated with each alternative.
Appendix A – Evaluating Community Sustainability
Identify needs. Needs are universal and invariant aspects of human nature, and if needs are unsatisfied there will be degradation to the self, family, or community. Examples could be Food, water, shelter, love, purpose, intimacy, etc.
Identify the boundary of needs. While the needs are expected to be universal, the boundary of needs can be unique to the community. Food may be a need, but does that include imported food? Fast food? More than 3000 calories per day? For people in Oakville, it may mean following the Canada Food Guide, but in Grise Fjord, it may mean eating country foods. And the boundary could be different for each community for any given need.
Identify activities expected to meet needs. These would be time-use activities, and they can be ones that are already listed in the General Social Survey, or they can be additional specific activities that are meaningful for the community. When considering which paid activities are meeting needs, consider the same number of digits of the NAICS codes for consistency. Thus, if using 4 digit codes, use 4 digit codes throughout.
Identify the symptoms of unmet needs. To determine if the needs are being met during the polling portion of the study, the community has to identify what the various symptoms of unmet needs would be. For food, that could be less than a certain number of calories based on body mass and activity. Perhaps it is a measure of food insecurity. Maybe it is a specific fraction of income spent on food, or access to gardening or gathering. It could be many or few symptoms.
Poll the community. Collect time-use data, ecological footprint data, resource use, energy use, and the presence of the symptoms of unmet needs from enough people to be confident that all identifiable subsets of the economy have been sampled in sufficient detail to understand how that subset will react to any given change.
Determine the biocapacity of the land/air/water than the community is stewards of, in the absence of imported biocapacity. This is the sum of the lesser of the ecological footprint of the community and the biocapacity of each biome under stewardship by the community. The carbon biocapacity comes from the sum of surplus of each biome.
Determine the future energy supply, assuming all low EROI energy production has ceased to be available. This can be set to values between 7:1 (borderline first world) and 11:1 (borderline growth economy).
Provide a list of the resources being used by the community that come from the community. Determine the reserves, and the current rate of production for both local use and export from the community. For those reserves that would exhaust during the longevity of the existing infrastructure (say 40 to 150 years), determine what opportunities exist to substitute, extend, or retain the resources. Determine an expected future production rate that will either allow for alternatives to be developed prior to exhaustion or would allow a declining production rate to ensure ongoing availability.
Calculate the Future Time Costs: Find the slope of the time/ecological footprint curve at the CMBC, and the slope of the time/energy curve at the future expected energy production. Convert the time-use data into Potential Quality of Life.
Calculate the effectiveness of the people in the community at meeting their needs. Find the ratio between those people with their needs unmet due to inadequacies of time instead of some other obstruction, to be able to determine how much time would be used if all people could meet all their needs, and show how this distributes across the economy.
Plot the distribution of Potential Quality of Life and Actualized Quality of Life. Determine that portion of the population that is within each of the ranges (subsistence, poverty, sustainability, affluence, imminent collapse), and then re-evaluate the boundary of needs, the activities expected to meet needs, and the symptoms of unmet needs to determine if an adjustment to the community-defined performance envelope will make a meaningful difference.
Determine how much additional biocapacity would be required to bring the whole community above poverty. Check with surrounding communities to determine if this is available in the surplus of the surrounding communities. Can a co-stewardship arrangement be undertaken? Would a larger community scale make this more manageable? This can become a very large study. What would be required to provide this additional biocapacity from within the community?
What are the needs that the community has sovereignty over? What can the community do without having to involve other levels of governance to reduce the barriers to these needs being met? Which levels of governance or which communities does the community have to develop co-stewardship arrangements with?
What ecological functions does the community use that can be enhanced to improve quality of life?
Determine how much additional effectiveness would be required to bring the whole community above poverty. By looking at the raw data, determine where the most significant improvement of effectiveness could come from.
Bring back to the community to show what the direction provided produces.
This then can be used for any combination of planning:
Determining what co-stewardship arrangements are required (who has either a surplus or a deficit of specific biomes, energy, resources)
Determine what adjacent communities can be considered in the planning scale. Does adding Ottawa to Gatineau for planning increase the quality of life for each?
Determine how resources of the agglomerated community can be best managed.
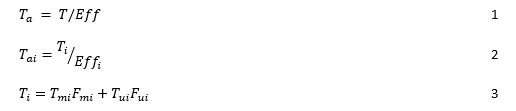
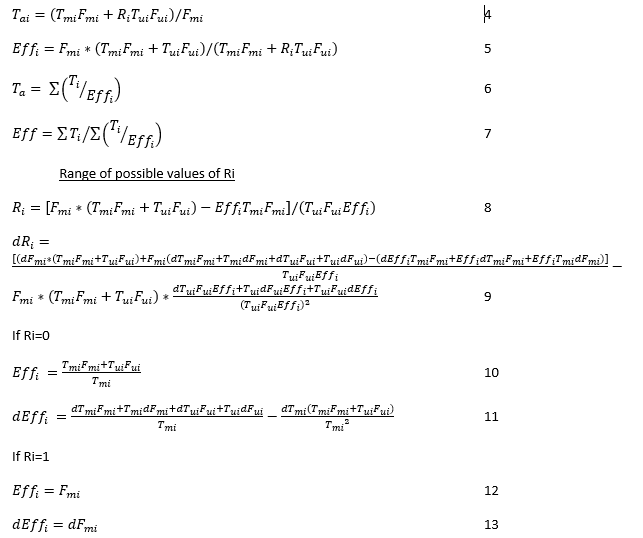
Appendix B – Calculating Effectiveness
The terms in the calculation are defined below:
Tui = average time used in the community for those people who have a symptom of need i being unmet
Fui = fraction of the community population that has a symptom of need i being unmet
Tmi = average time used in the community for those people who do not have a symptom of need i being unmet
Fmi = fraction of the community population that does not have a symptom of need i being met.
T = the average time used to meet all needs by all people
Ti= the average time used to meet need i by all people
Ta= the average time used to meet needs by all people, as if all needs were met
Tai=the average time used to meet need i by all people, as if all needs were met
Effi = the calculated Effectiveness of the community at meeting need i.
Eff = the time weighted average Effectiveness of all needs.
Two different assumptions can be made to frame the possible range of values that Effectiveness can have. The first assumes that all of the time used at meeting needs is effective, regardless of whether the need is met or not. Those people who do not have their need met just need to use more time. The second assumes that all of the time used at meeting needs is effective, but only if the need is met. Otherwise, it is entirely ineffective. No matter how much additional time is used, the need will still be unmet.
We can find the general case, by assigning a value for the fraction of time used by those that have symptoms of unmet needs that is effective at meeting their needs.
Ri = the ratio of the number of people with unmet needs who are using their time effectively, to the number of people in the population, for need i.
For each Ri, substitute Effi and dEffi into Equation (9) to determine dRi, and then find the linear interpolation of Ri where dRi=0. While it is assumed that dRi=0 between two points of time, Ri can not be outside of the range of 0 to 1, so if Ri is calculated to be greater than 1, set Ri=1. If Ri is calculated to be lower than 0, set Ri=0.
If a sufficiently long time series is available, Ri can instead be determined as a best-fit line, so that Ri’’ is either 0 or slowly changing.
Once Ri is established, Effi can be calculated, and with Effi, the impacts of any development initiative on the community’s quality of life as it relates to that specific Need, be it through Human Development or Technological Development, can be predicted.