So, all pages here so far talk about the efficiency by which people use their time to meet their needs – either directly, or by converting resources into the means to meet needs. Nothing talks about effectiveness, and that’s where this all has to go.
The poorest people in Canada use around 900 minutes per day to meet their needs. The rest of their time is not spent meeting needs. I don’t believe that everyone in the poorest decile of household income have all of their needs met, so that means that even if they have 1/3 of their time available to meet needs, for some reason they can not use the time to meet needs. Something prevents them from doing so.
Perhaps it is an obstruction from inside their self, or their family, or their community, but there is some obstruction. Perhaps it’s racism, or addiction, or domestic violence. Perhaps it’s cultural baggage, or a lack of education. But whatever it is, I think it makes people not completely effective at using their time to meet their needs.
I think:
- People use their time to meet their wants and needs, or they use their time convert resources into the means to meet their wants and needs.
- And at the same time, people act at all times (there will be some specific exceptions) to meet their perceived needs.
Which implies that the perception of needs for most people is part of the obstructions. Perhaps the difference between ‘surviving’ and ‘thriving’ is knowing when your needs are met and thus when you can meet wants at your leisure?
This ‘effectiveness’ would provide a perpendicular dimension to the Time/Resource curve already discussed, and may look something like this:
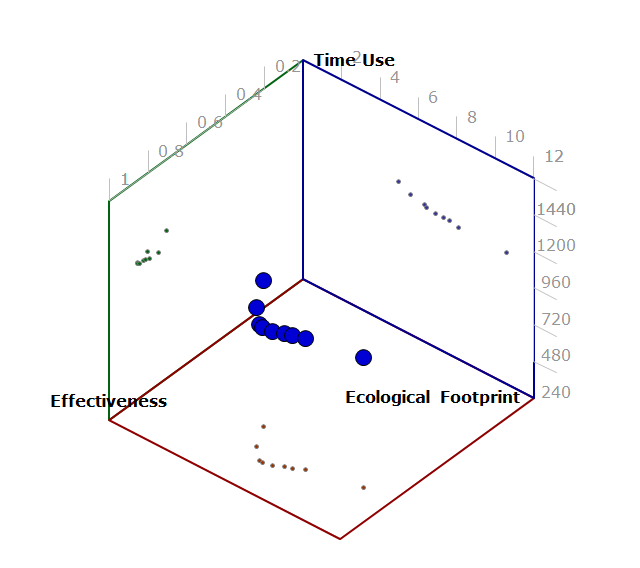
This curve would be generated by asking community members about their consumption habits, time use, and what symptoms they experience that predicts what obstructions they experience. It would be a time-weighted average across each sub-set of the community, and all of the aggregated data is plotted together (average for the group, plus really should show distribution bars).
So, if a respondent demonstrates that 70% of their needs are met, the data would include which 70%, so there would be like Table B1 in my paper here – except that it would be the average values of how much of each need isn’t met within the community. The community as a whole can then be checked to see how it would end up responding to any given alternative design, based on the obstructions that prevent the population from making full use of the development.